A cute hypothesis test question
Thanks Reddit
I frequent r/askstatistics which despite the efforts of the mods still contain a lot of homework question posts. I never really mind though since
- I like trying to be helpful on the internet
- Sometimes you hit on fun little questions
This week, I found one post that I think is a really solid test of some intro stats knowledge, and potentially a good job interview question.
The question
Here’s the version that I read. It’s a two-parter.: “You have an urn with 12 balls in it. You are told that 8 are black and 4 are white, but maybe that source is untrustworthy. You draw 3 balls from the urn without replacement. Come up with a hypothesis test for whether or not the urn really has 4 white balls.
Once you have your test, suppose that you get 0 white balls in your sample. What p-value does your test give?”
Why I like it
What I like about this question is that it’s different than a standard t-test or binomial proportion test, but still a scenario that anyone who has taken a statistics class is familiar with. To answer it effectively, you need a to have a solid grasp of intro-level probability, be able to think critically about the general framework of a hypothesis test, and properly define a p-value.
How I’d do it
What are the ingredients you need for a hypothesis test?
- A null and alternative hypothesis
- A test statistic with some reference distribution
Hypotheses
We are supposed to be testing whether or not the urn really has 4 balls. We could write something like this:
- $H_0: \text{number of white balls} = 4$
- $H_0: \text{number of white balls} \neq 4$
The test statistics $T$ then could be the number of white balls in your sample of 3.
We can put this problem into a probabilistic model that will give us a more formal set of hypotheses and some useful things about our test statistic.
How can we calculate the probability of some number of white balls in your sample of 3, given that we have 4 white balls in an urn of 12 total balls? It’s tempting to immediately jump to the binomial distribution, but we can’t use that since we are sampling without replacement. Every draw is going to have a different probability of getting a white ball!
The (often forgotten) hypergeometric distribution can help us here. Suppose we define $K$ to be the number of white balls in the urn:
Most classes should have at least touched on the hypergeometric distribution, but even if they haven’t, someone comfortable with basic probability should be able to work out the probability mass function.
Now we can rewrite the hypotheses in terms of the parameter $K$:
- $H_0: K = 4$
- $H_0: K \neq 4$
And we know that our test statistic is distributed according to the hypergeometric distribution.
Quick rundown: Hypotheses? Check. Test statistic? Check. Reference distribution? Check. Nice, let’s do some computation.
Some R code
We’ll have to use a computer now to get the probability mass function with null hypothesis $K = 4$. Here’s some quick R code.
n_black <- 8
n_white <- 4
sample <- 3

probs <- dhyper(x = 0:3,
                n = n_black,
                m = n_white,
                k = sample)
> probs
[1] 0.25454545 0.50909091 0.21818182 0.01818182
Now the last part; let’s say we drew 0 white balls
We see that there was an approximate .254 probability of observing 0 white balls if our null hypothesis was true. However, this is not our p-value.
Recall that the definition of a p-value is the probability of observing an test statistic at least as extreme as the one we observed, given that the null hypothesis is true. For a t-test, this was done by calculating the probability of being in the tails of the distribution past the test statistic value. Since the t-distribution and Normal distribution are symmetric, if the alternative hypothesis was two-sided that probability was simply multiplied by two. A two-sided test like what we have developed above is slightly more complicated because the distribution will not be symmetric and we’ll have to actually look at which value of the test statistic are more extreme (aka less likely) than that which we observed.
Let’s plot this probability mass function under the null hypothesis.
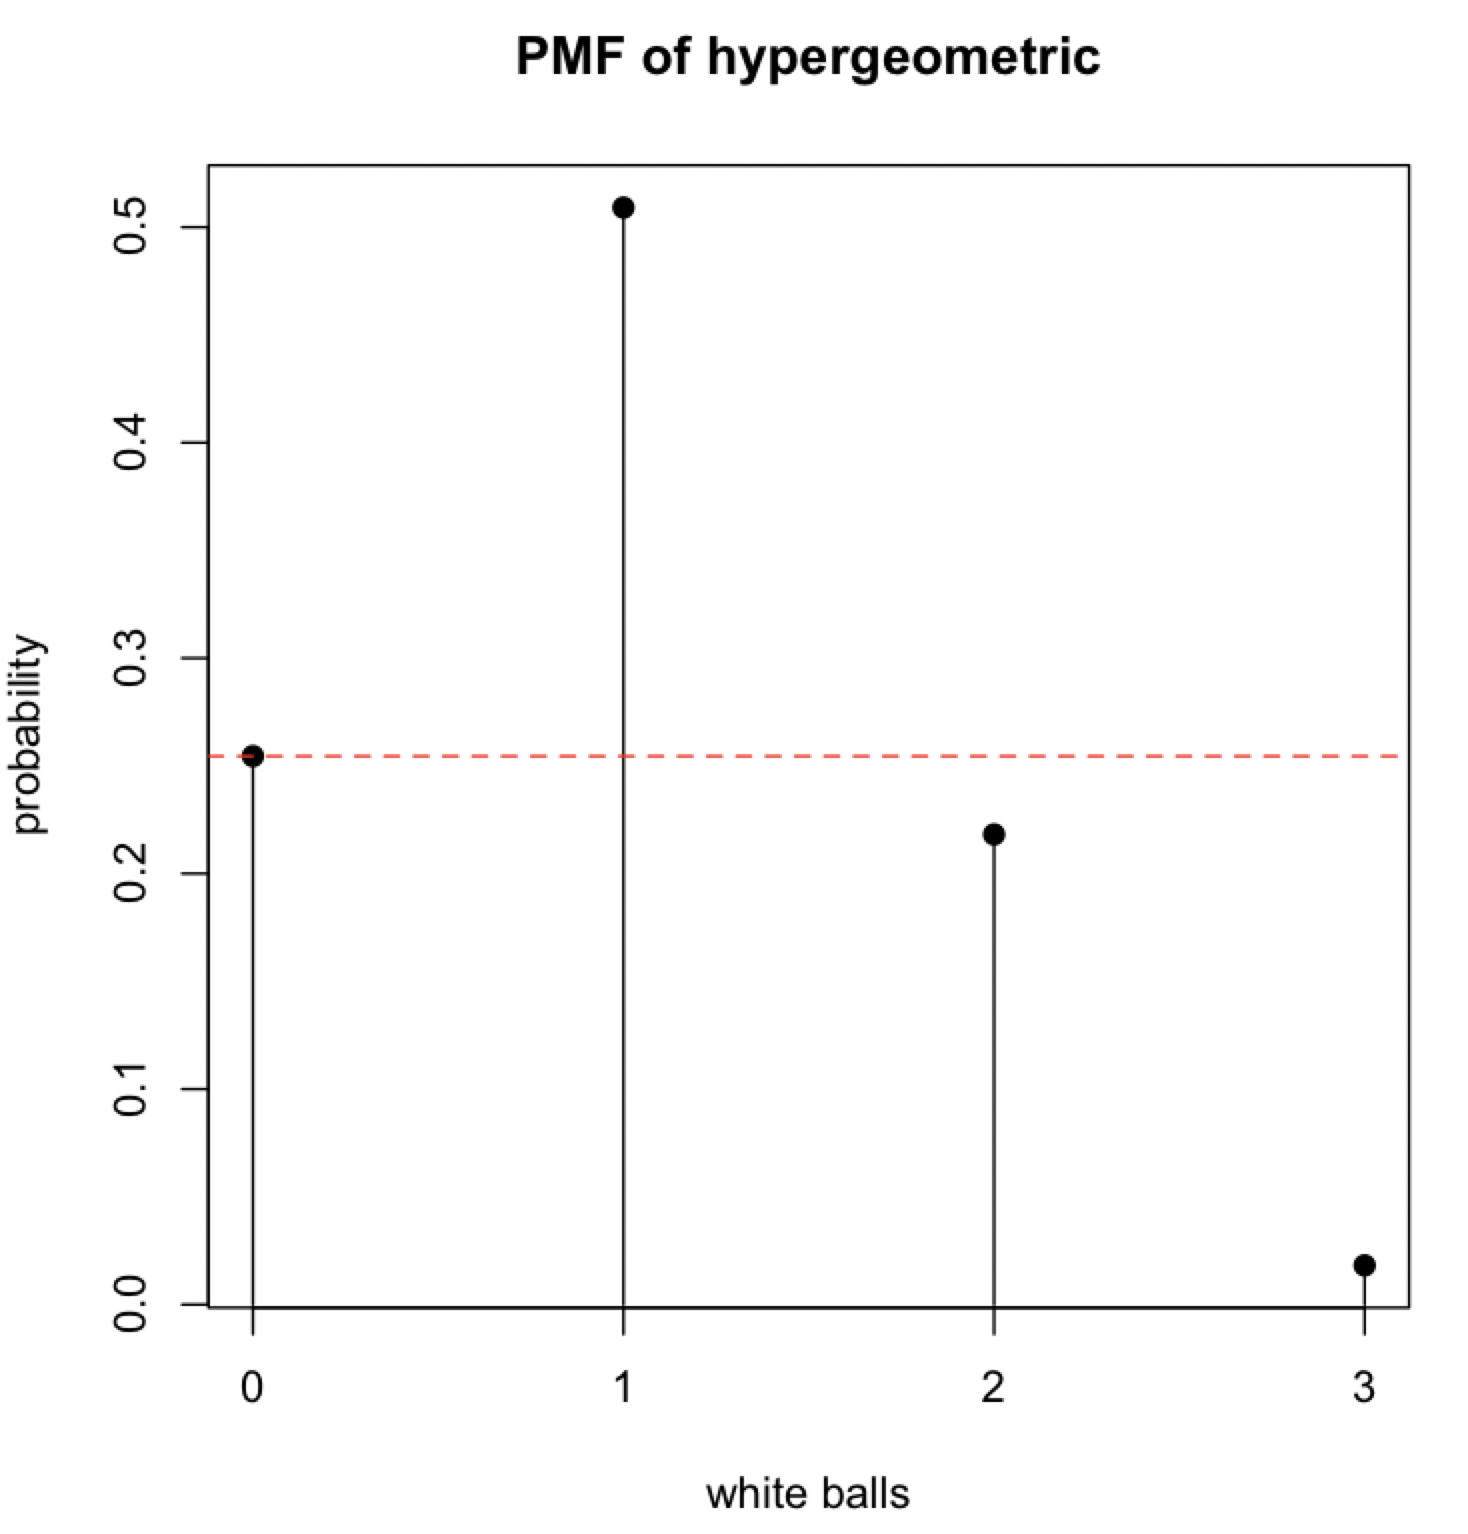
The red line represents the probability of observing 0 white balls. We see that observing 2 and 3 white balls is actually less likely than observing 0 white balls. Therefore, these test statistic value are more extreme than what we observed! This allows us to calculate the final p-value of $.254+.218+.018=.491$.
And of course if this was an exam or interview question, I would expect some statement like: “According to this test, if we draw 0 white balls, we have no statistically significant evidence that the number of white balls is different from 4”.